London Climate Risk Maps – A spatial analysis of climate risk across Greater London

Introduction
This article uses text from the Great London Authority website. The methodology used to produce the Climate Risk Maps is available in the right hand column. Use this to find more detail and reference the maps.
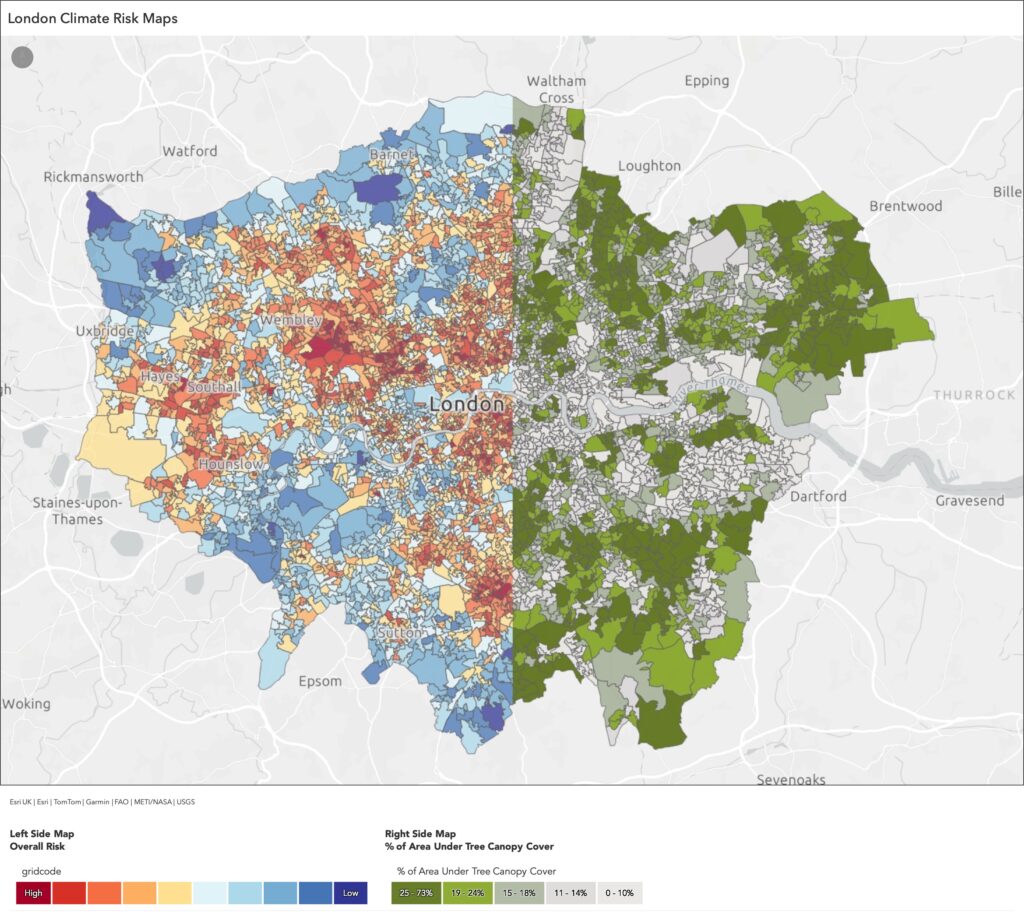
A series of London-wide climate (heat, flood, overall) risk maps has been produced to analyse climate exposure and vulnerability across Greater London. These maps were produced by Bloomberg Associates in collaboration with the Greater London Authority in 2020 to help the GLA and other London-based organisations deliver equitable responses to the impacts of climate change and target resources to support communities at highest risk. Maps were updated in 2024, see more detail below.
Climate vulnerability relates to people’s exposure to climate impacts like flooding or heatwaves, but also to personal and social factors that affect their ability to cope with and respond to extreme events. High climate risk coincides with areas of income and health inequalities. A series of citywide maps overlays key metrics to identify areas within London that are most exposed to climate impacts with high concentrations of vulnerable populations.
In 2022, Bloomberg Associates updated London’s climate risk maps to include additional data layers at a finer geographic scale (LSOA boundaries). These maps were built upon earlier maps using the Transport for London (Tfl) hexagonal grid (often referred to in this report as the “Hex Grid”). In addition, the map interface was updated to allow users to compare individual data layers to the Overall, Heat and Flooding Climate Risk maps. Users can now also see the specific metrics for each individual LSOA to understand which factors are driving risk throughout the city.
In 2024, Bloomberg Associates further modernized the climate risk maps by updating the social factor layers to employ more recent (2021) census data. In addition, air temperature at the surface was used in place of just surface temperature, as a more accurate assessment of felt heat.
The data layers at the LSOA level are available here to use in GIS software:
Climate risk scores (overall, heat, and flood)
Social and physical risk variables
Interactive Map
Risk Map Criteria
Flood Risk Map: Ages Under 5, Ages Over 75, English Proficiency, Income Deprivation, Social Renters, BAME, Surface Water Flood Risk, Green/Blue Land Cover, Areas of Deficiency in Access to Public Open Space
Overall Climate Risk Map: Ages Under 5, Ages Over 75, English Proficiency, Income Deprivation, Social Renters, BAME, Average Air Temperature, Surface Water Flood Risk, PM2.5, NO2, Green/Blue Land Cover, Areas of Deficiency in Access to Public Open Space
Heat Risk Map: Ages Under 5, Ages Over 75, English Proficiency, Income Deprivation, Social Renters, BAME, Average Air Temperature, PM2.5, NO2, Tree Canopy Cover, Areas of Deficiency in Access to Public Open Space
Recommended citation
Greater London Authority (2022/2024) London Climate Risk – A Spatial Analysis of Climate Risk Across Greater London. Available at: https://data.london.gov.uk/dataset/climate-risk-mapping-2oxg6/ (Accessed: [Insert Date]).
You are encouraged to use and re-use the Information that is available under this licence freely and flexibly, with only a few conditionsoutlined in the Open Government licence.
Tool background
The Mayor worked with Bloomberg Associates to analyse exposure and vulnerability to climate change across Greater London. They will help the Mayor and other London-based organisations to target resources to support communities at highest risk of the impacts of climate change.
‘Climate vulnerability’ relates to people’s exposure to climate change impacts like flooding or heatwaves, but also to personal and social factors that affect their ability to cope with and respond to extreme events. High climate risk coincides with areas of income and health inequalities. This city-wide map overlays key metrics to identify areas within London that are most exposed to climate impacts with high concentrations of vulnerable populations.
The London Mayor is addressing these climate risks and inequalities through the work of the London Recovery Board, which includes projects and programmes to address climate risks. Ambitious policies in the London Environment Strategy and recently published new London Plan are also addressing London’s climate risks.
Visit the climate change adaptation pages for more information on programmes and projects that address these risks.
Further resources

The London Green Infrastructure Framework

Comments
There is no contentYou must be logged in to reply.