Climate Risk Dashboard
Climate change has the potential to significantly impact the UK across all walks of life, from directly affecting our environment, to disrupting our economy and increasing costs, as well as damaging our health and culture.
The effects of climate change are already having direct and tangible impacts on local communities across the UK, causing warmer, wetter winters and hotter, drier summers.These, in turn, will be coupled with an increase in unusual and extreme weather events, causing more frequent hazard events such as floods, droughts, and heatwaves.
The OpenCLIM project has looked across 6 sectors to explore the potential impacts of climate change and using a small number of examples how adaptation may be able to reduce these impacts. Key results from this work are summarised in an interactive dashboard tool, with links to further resources and underlying datasets also included.
What and who is the toolkit for?
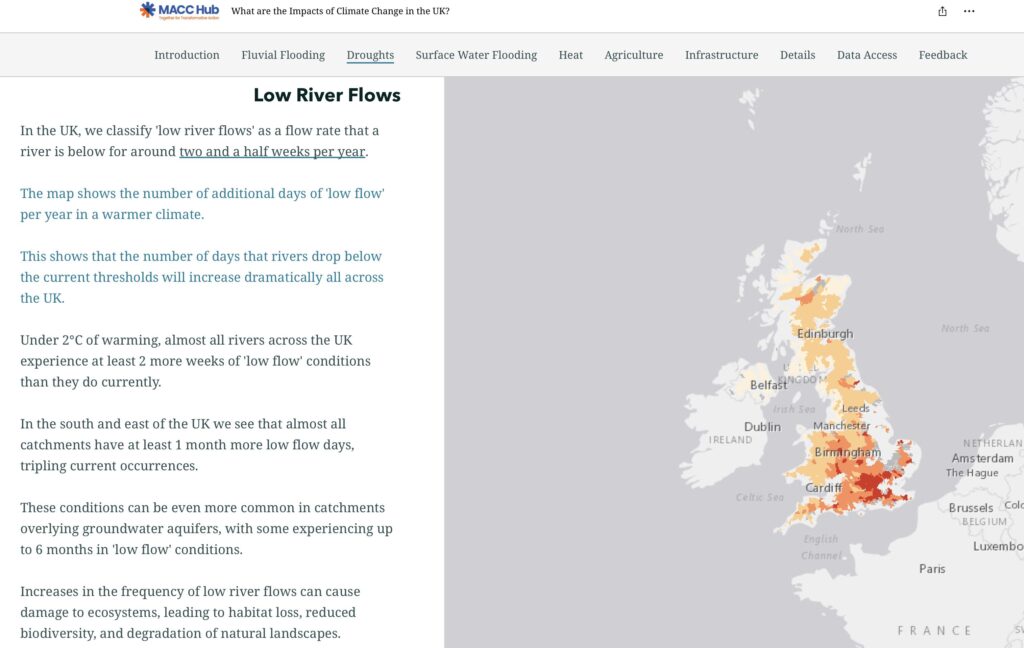
The created tool is aimed at policy makers and those more generally who are wishing to understand more the potential impacts of climate change in their regions and communities. Covering 6 sectors; droughts, urban surface water flooding, fluvial (river) flooding, extreme heat, agriculture, and road infrastructure, there is a range of interactive maps to explore on each theme.
For those wishing to undertake further and more detailed analysis, many of the datasets used in the tool are available to download.
Click the button below to explore the OpenClim Climate Risk Dashboard.
Feedback
We’d love to hear your feedback, be that good or bad, and especially any case studies where you have used the tool to help inform policy changes, make decisions or for any other purposes. Please click the following button to share your feedback (this can be also be accessed in the dashboard).
Further resources
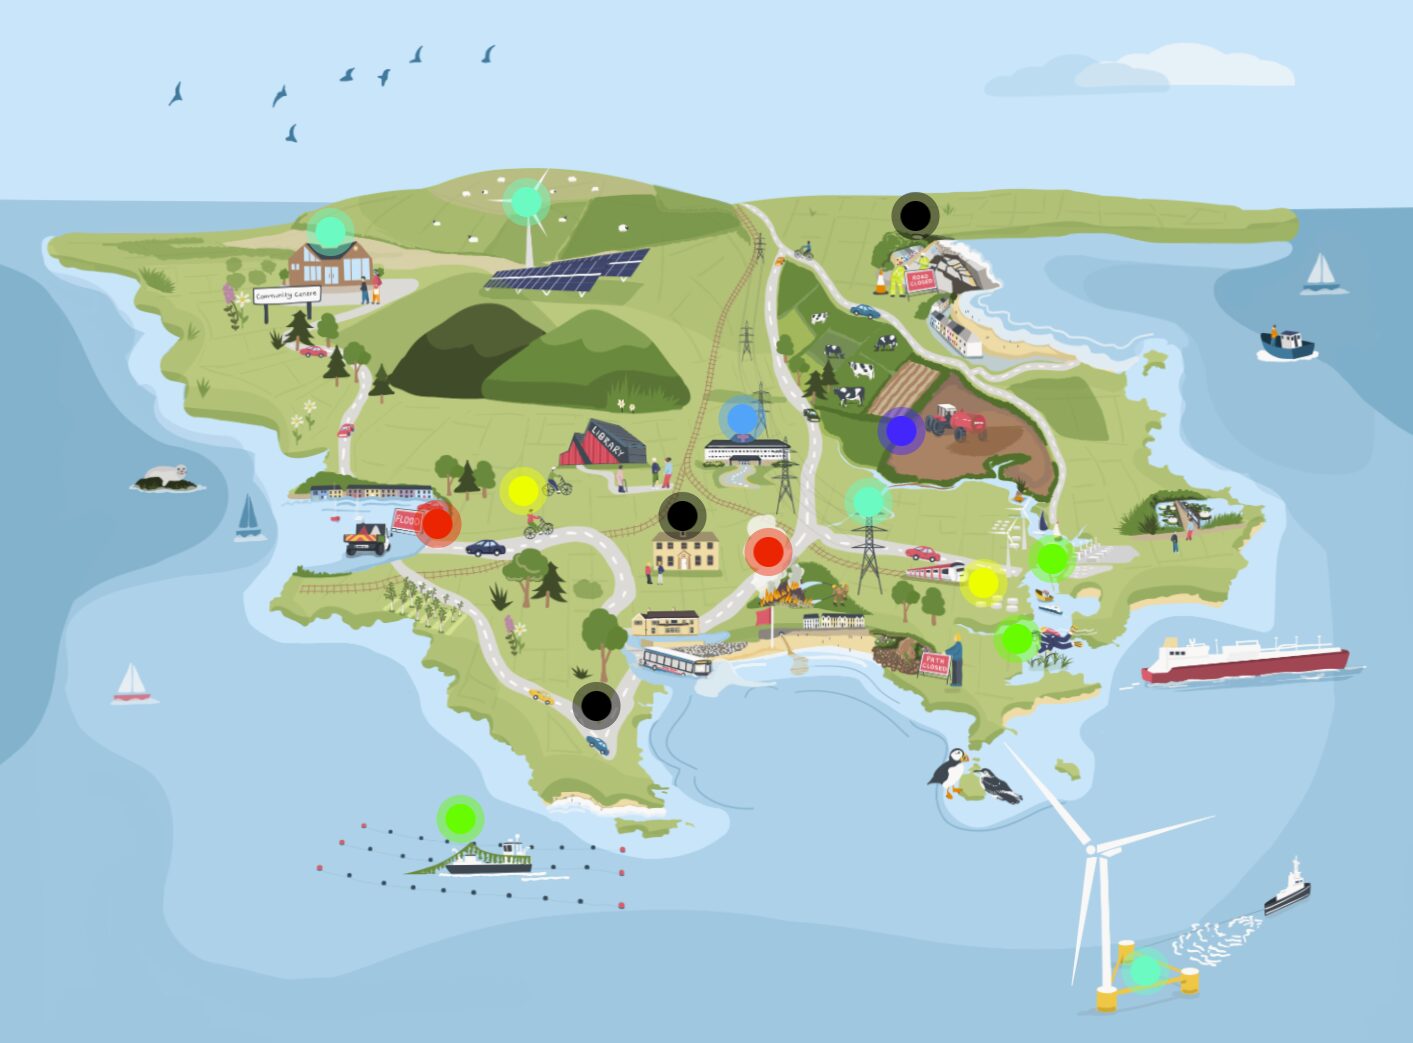
Climate Adaptation Toolkit – Pembrokeshire
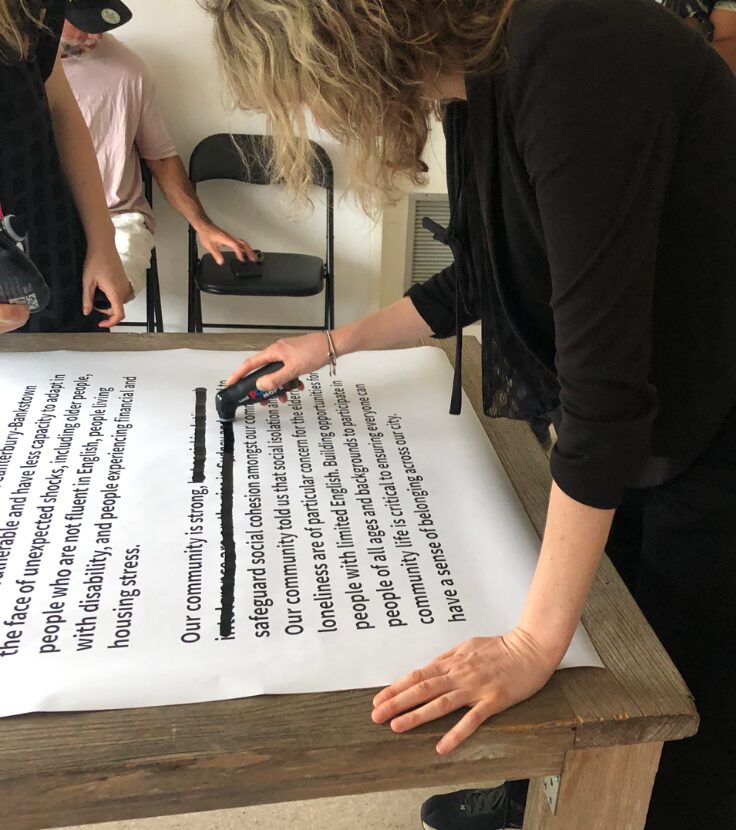
New innovative art-based toolkit for climate resilience
Comments
There is no contentYou must be logged in to reply.