Is climate change making UK droughts worse?
This piece was originally published by Jamie Hannaford, Lucy Barker, Wilson Chan, Steve Turner, as a Guest Post on Carbon Brief (26 August 2025)
The year 2025 has seen exceptionally dry conditions in many parts of the UK. At the time of writing, a large area of England is officially “in drought” and hosepipe bans are in force for more than 8m households.This follows severe drought episodes in the summers of 2022 and 2018 – which raises the question of whether these events are part of a pattern towards a drier future. However, the intervening periods between these drought events have been associated with major floods.
There is good reason to assume this “hydrological volatility” could be linked to climate change. This article explores how climate change might be impacting UK river flooding. Here, the theme was revisited – but looks at whether global warming is driving a long-term trend towards increasing drought severity in the UK. To do so, findings from a 2023 Environment Agency report were drawn
Key findings include: Future projections indicate hydrological droughts will become more severe in the UK, especially over the months of April to September, due to hotter, drier summers. However, observations from the past 50 years – and longer where records allow – do not provide evidence of worsening drought. This apparent conflict is largely because natural climate variability can obscure underlying trends driven by climate change. An increasingly variable climate in the UK means planners still need to prepare for more severe droughts, as well as more floods.
The 2025 hydrological drought
Droughts are complex events that vary in duration, time of year, location and severity.
They are often categorised into different types. For example, a meteorological drought is defined by a lack of rainfall – whereas agricultural drought is a period when there is not enough water for crops to grow.
Here, the focus is on hydrological drought, which is when a lack of rainfall results in less water in streams, lakes, rivers and reservoirs.
In particular, the focus is on deficits in river flow. It is through dwindling river flows that droughts have some of their greatest impacts on society and the environment.
Over March-July of this year, flows for many UK rivers were at their lowest level on record. Hosepipe bans have been introduced by water companies, while the Environment Agency has imposed restrictions on extracting water from rivers and warned of widespread environmental impacts, such as fish die-offs and algal blooms in rivers, streams and lakes.
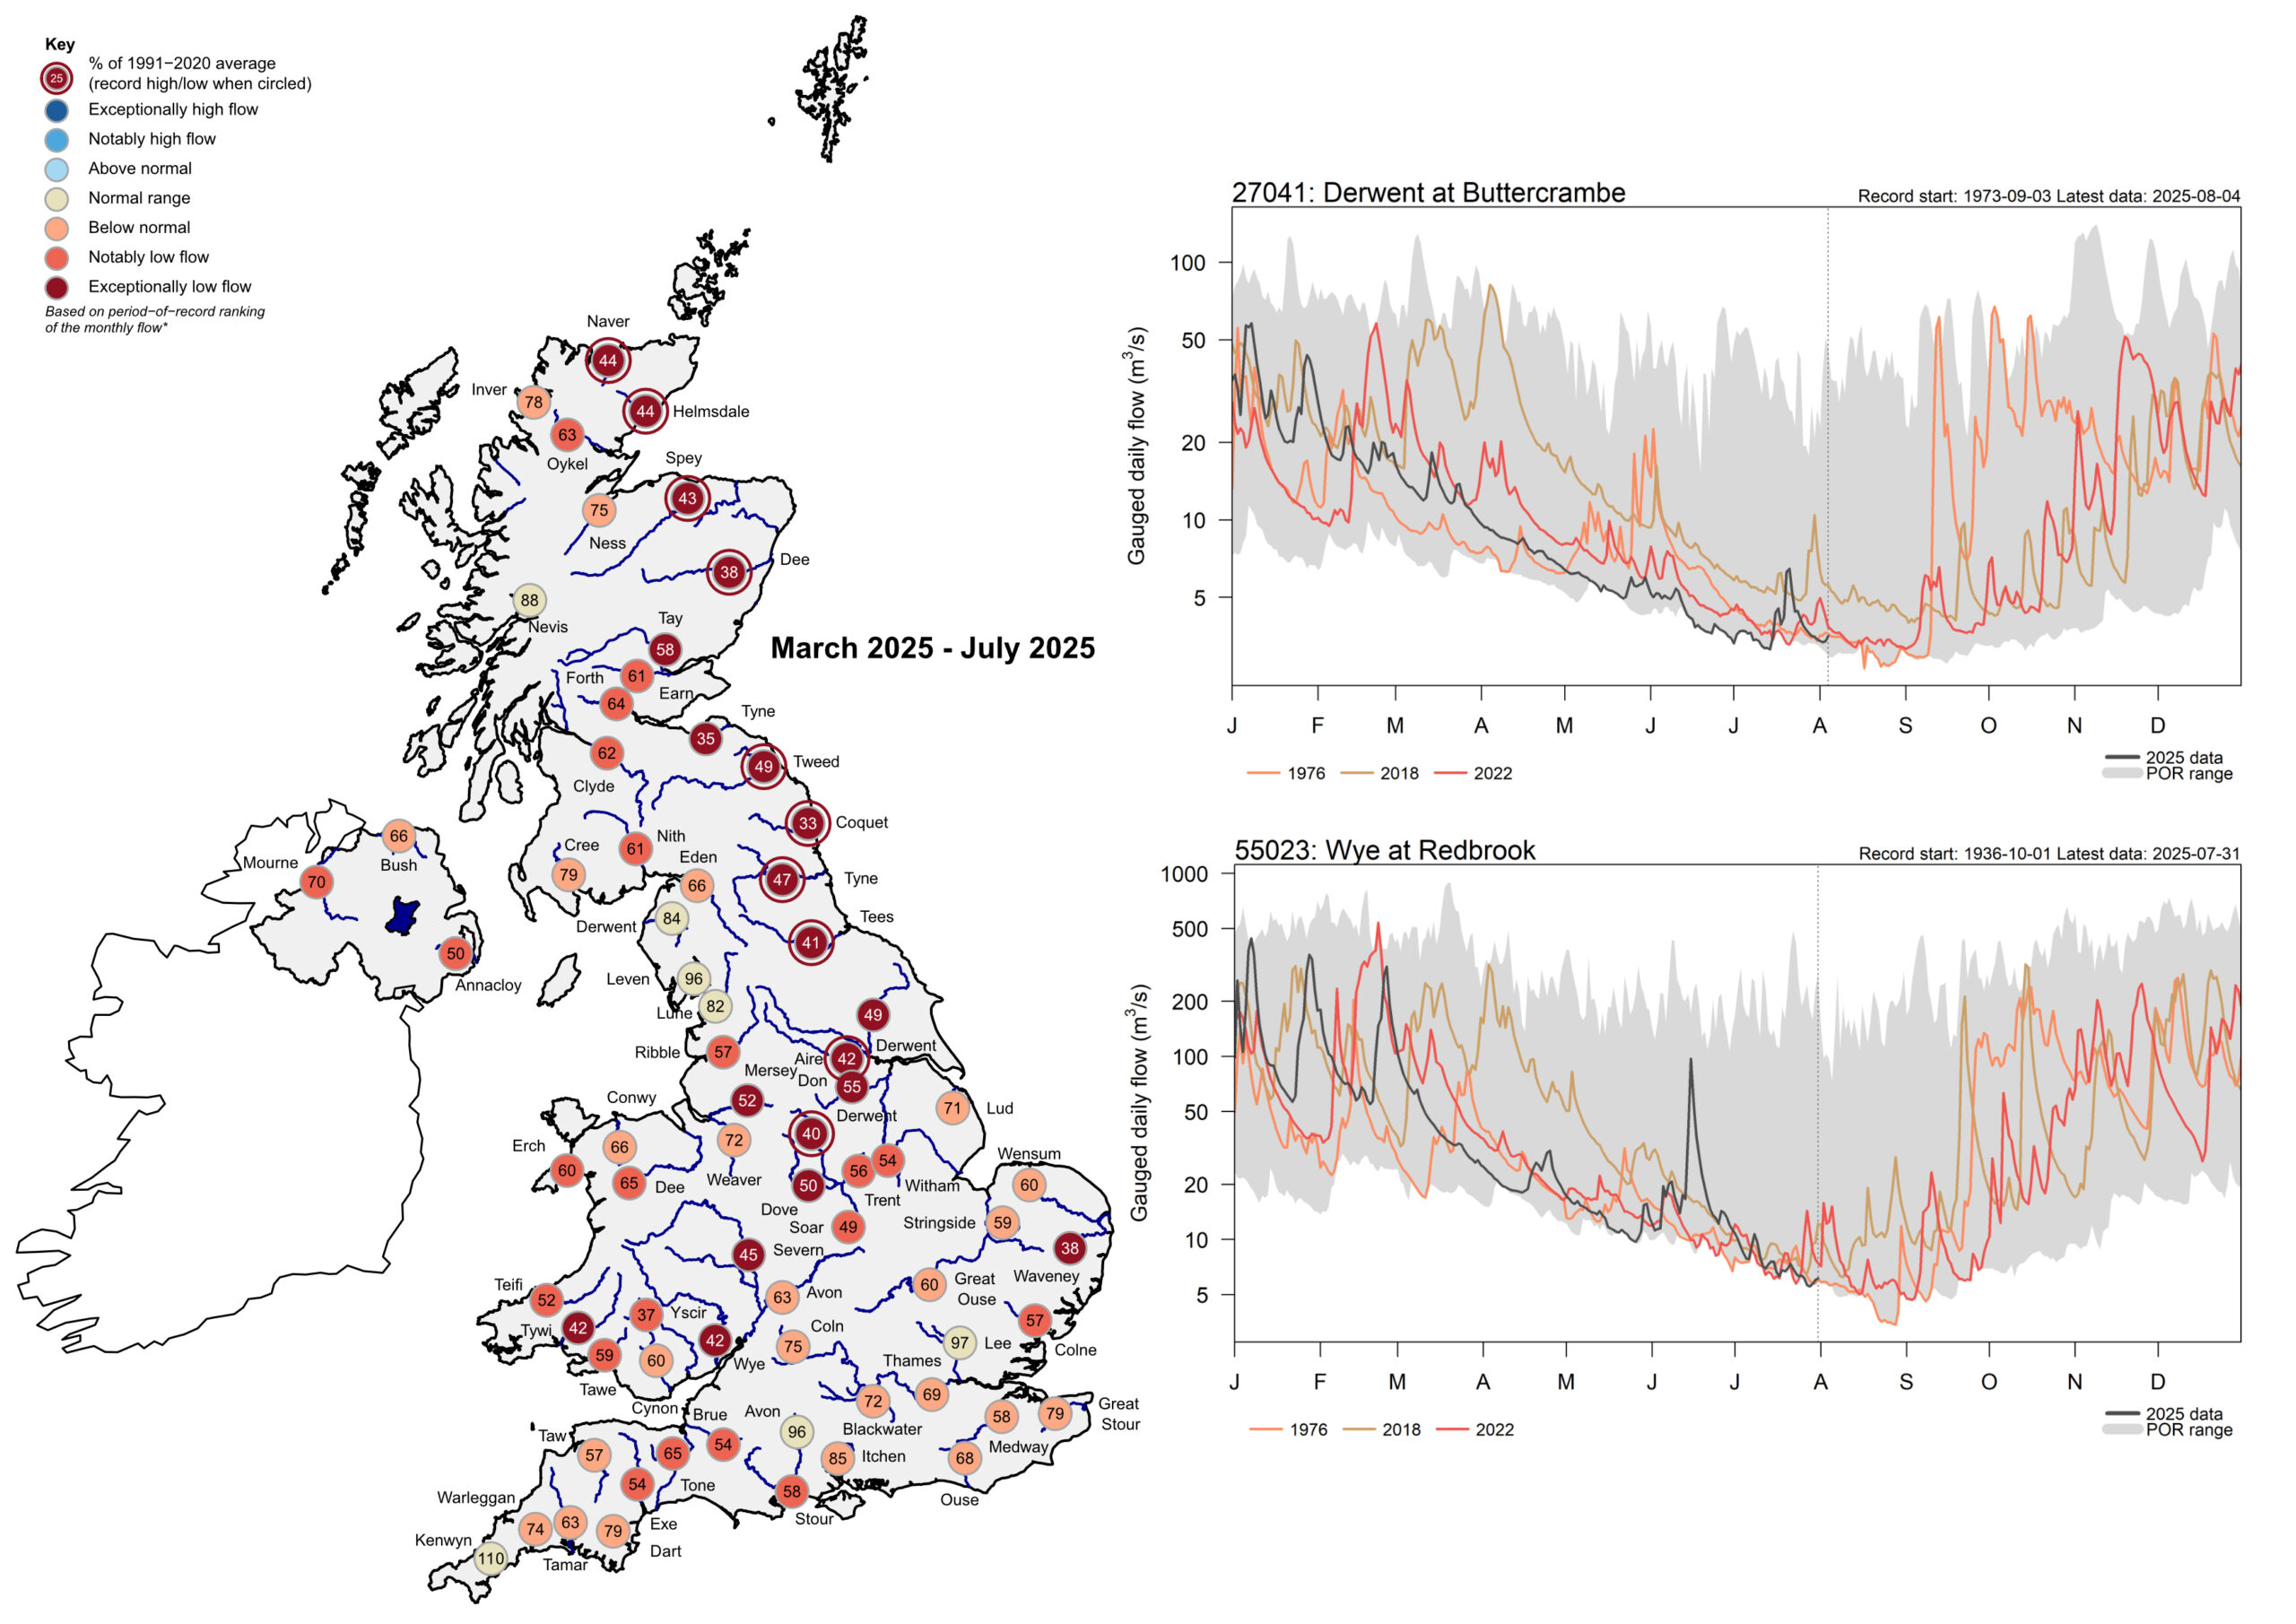
The map below shows how a significant number of rivers in the UK this spring saw exceptionally low flows (marked by a dark red circle) or notably low flows (marked by an orange circle) compared to the 1991-2020 average. This includes many rivers in northern parts of Great Britain – which is typically wetter the south-east.
The graphs on the right, meanwhile, show how flows in the River Derwent and the River Wye (black line) in 2025 have been at equivalent levels, or lower, than in major past droughts (red, green and orange lines). This includes the record-breaking drought of 1976 (orange line), often used as a benchmark.
Past trends in drought
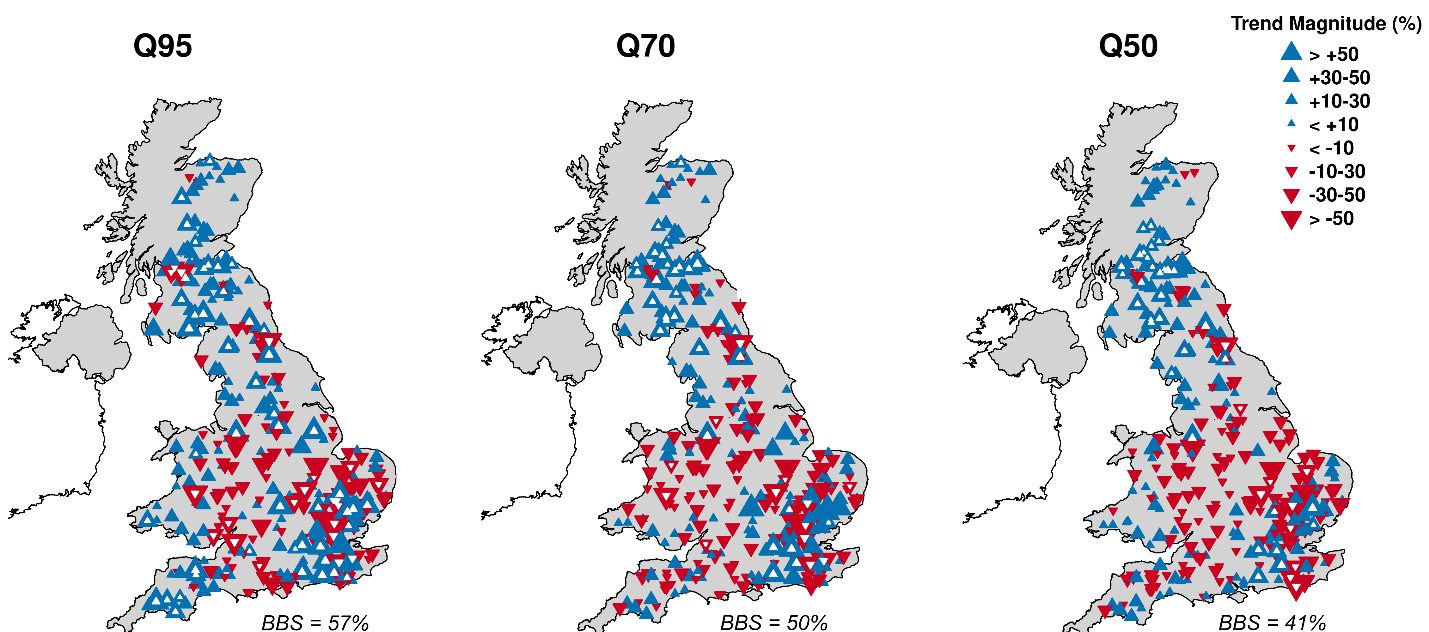
Given these projections, it is expected to see a similar trend of decreasing minimum flows emerging in observational data over the last few decades. However, research concludes that there is little compelling evidence for any evidence of a widespread worsening of UK droughts over the last half century – yet. The maps below show how river flows have changed since 1965 across the UK for very low (Q95), medium-low (Q70) and median (Q50) flows. For much of the north and west of the UK, the lowest flows in each year have, in fact, increased since 1965 (blue triangles). In the south and east of the country, there are decreases (inverted red triangles), but it is a mixed picture. Overall, the number of statistically significant trends is modest.
Credit: Adapted from Hannaford et al (in press).
Observed trends in three different indices of low river flows for 1965-2022. ‘Q’ values represent different percentiles, where Q95 is the river flow that is exceeded 95% of the time in each year (i.e. very low flows), Q70 is for medium-low flows and Q50 is the median river flow. Red triangles show decreases – low flows getting lower – and blue triangles represent increases, with the size of the triangle representing the magnitude of change. White shading on the triangles shows changes that are statistically significant.
But, while these river flow records span more than 50 years, this is still a relatively short timeframe. As a result, much longer records were explored, including “reconstructed” river flows, which stretch back to 1890. Here, too, it was found that there is no consistent trend towards worsening drought over these long periods. In fact, research shows how trends in the last 50 years are often unrepresentative of longer-term changes. Some of the apparent decreasing trends from the maps above disappear when a longer view is taken.
Mismatch between past trends and future projections
There is a clear contradiction between future projections and past trends. There isn’t much evidence of the drier future that climate models project. However, this apparent contradiction is unsurprising once uncertainties inherent in both future projections and historical observations are considered. Future projections are highly uncertain and span a wide range of possibilities – as shown by the multiple lines in the Eflag graphs above. Caution is needed in interpreting trends in observations, too. While 50 years seems a reasonably long period, trends can be influenced by variability associated with natural atmospheric and oceanic circulation patterns. The trends towards increasing river flows in the north and west are consistent with changes in the North Atlantic Oscillation (NAO) – the atmospheric pressure system that influences the UK’s weather on year-to-year and decade-to-decade timescales.
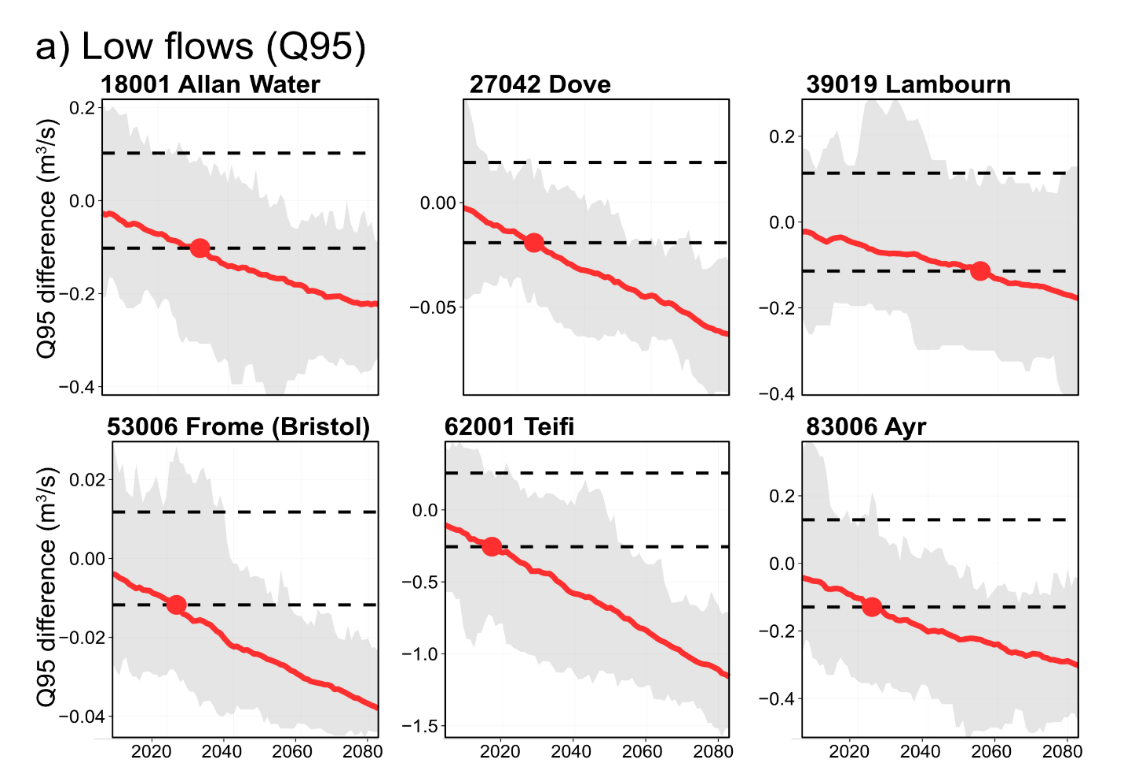
There is a growing list of drivers of drought variability, including the El Niño-Southern Oscillation (ENSO) and the role of the influx of freshwater into the North Atlantic due to the melting of the Greenland ice sheet. In a recent paper, it was highlighted that long-term trends in low river flows for many UK catchments may not be detectable for decades due to being obscured by natural climate variability. This is shown by the plot below, which illustrates how projected trends of very low river flows over the 21st century (red line) contrasts with the estimated range of historical river flow variability (dashed lines). (The grey shading shows the range of different climate models.) It shows that for some catchments – for example, the Lambourn River in south-east England – significant trends do not emerge until the 2050s.
Credit: Adapted from Chan et al (2025).
Projections show reduced river flows in six selected catchments up to 2080. The grey shading is the range between different climate model members and the dashed lines indicate the estimated range of historical river flow variability. The red dot denotes the year at which a statistically significant trend can be detected.
Part of the mismatch between historical observations and climate projections for UK summer is due to a run of wet summers from the late 2000s onwards. This climate variability has ‘masked’ an underlying trend that could eventually emerge and bring a more worrisome consistency with the projections of climate models. That this masking has often entailed living with an excess of water, in the form of widespread, damaging flooding, only highlights the challenges water managers face in a drier and wetter future.
A drier and wetter future
Further research is required into how different types of hydrological drought will evolve.
More droughts are expected in April-September, typically associated with heatwaves, as in 2025, 2022 and 2018. This is because warming temperatures – which, unlike rainfall trends, are certain – will exacerbate droughts.
The increased likelihood of hot, dry summers also means more rapid-onset “flash droughts”, which have impacts on soil moisture as well as river flows.
As such, the droughts of recent years should be interpreted as a warning that hotter temperatures will worsen drought impacts.
However, there is much less confidence that there will be more long, multi-annual droughts driven by dry winters that fail to replenish reservoirs and aquifers, such as those seen in 1988-93, 2005-06 and 2010-12. This is because climate models generally predict wetter winters for the UK. (These multi-annual droughts have, historically, posed some of the greatest challenges to water management.)
Nevertheless, climate variability means that even if winters get wetter, there will always be runs of dry years. This is a cause for concern, as the greatest problems occur when wet winters combine with dry summers. (It was the dry winter of 1975-76 which made the 1976 drought so severe).
The finding that it is difficult to confirm whether droughts are, overall, becoming more severe offers little comfort to water managers preparing for the future.
Research offers a number of recommendations for water planners trying to navigate this complexity. This includes using large climate model “ensembles” to test the resilience of water supply systems to different types of droughts. Although model projections are uncertain, they provide a way to assess the UK’s vulnerability to a range of future outcomes.
Furthermore, the hydrological volatility of the recent past indicates the importance of preparing for both a drier and wetter future in the UK.
The UK is known for its variable weather, but it will have a future climate that is even more variable and extreme.
Recommended citation
Jamie Hannaford, Lucy Barker, Wilson Chan, Steve Turner. Is climate change making UK droughts worse? Guest Post on Carbon Brief (26 August 2025).
Links
Further resources

CCC: England’s approach to climate adaptation is ‘not working’
Comments
There is no content